Tetrodes for Monkeys
J. S. Pezaris, M. Sahani, R. A. Andersen
CNS*95, Monterey, California, July 12-16, 1995.
Panel 1
WHY MULTIUNIT RECORDING?

- Local non-linearities in dendritic integration suggest that precise
temporal relationships between action potentials across different cells
can profoundly affect downstream processing.
- Better estimates of the redundancy and information content of signals are
available using simultaneously recorded traces.
- Correlations in firing patterns between neighboring cells can reveal the
underlying microcircuitry.
- Other workers have reported correlations between cells in mammalian
cortex.
WHY NEIGHBORING CELLS?
- Neighboring cells are known to share functional roles.
- Neighboring cells are known to be strongly interconnected, allowing the
maintenance of correlated or otherwise related firing patterns.
Panel 2
WHY TETRODES?
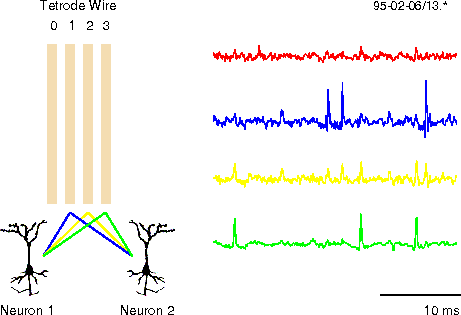
- Closely spaced electrode tips have overlapping hearing spheres.
- Asymmetries allow disambiguation of otherwise identical signals.
- In the left-hand diagram, Tip 2 is equidistant from neurons 1 and 2, and
signals from the two cells appear identical. With the addition of Tips 1
and 3, each of which is asymmetrically placed relative to the two cells,
both signals can be extracted.
- An example of this is seen in the right-hand diagram where the blue
trace shows action potentials from on neuron, the green trace showing
another neuron, and the yellow trace showing both at equal amplitude.
WIthout the addition of at least one of the lower traces, the action
potentials on the yellow trace would be erroneously attributed to a single
neuron.
Panel 3
MONKEYS?
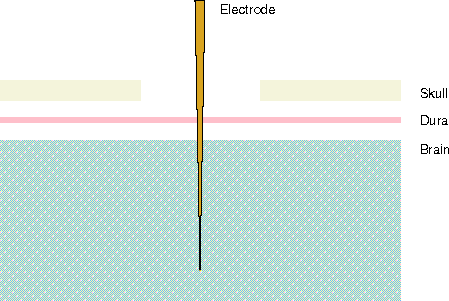
- The dura mater, a tough, leather-like membrane surround the brain, must
be left intact in chronic monkey preparations.
- The fine wires of a tetrode will not penetrate the dura.
- Many structures of interest lie quite deep within the brain.
- Thus, a means for puncturing the dura and delivering the delicate tetrode
to within 1 cm of the target area is required.
- We initially chose a method which uses a carrier tube to hold the tetrode
bundle within the brain (Mk I), combined with a normal guide tube to puncture
the dura. A modified design under development combines the two functions
(Mk II).
Panel 4
TWISTER
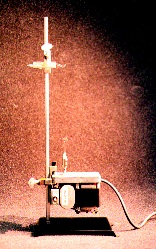
Two loops of fine wire are wound between the upper and lower glass hooks. The motor is then engaged for 75 turns for the pictured length (about 15cm), and a cyanoacrylate glue applied to the wire. Once the glue had set, the bundle is cut free and is then ready for insertion in the carrier. (Click here or on the photograph to see an enlarged area of detail.)
Panel 5
ASSEMBLY
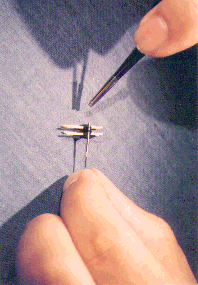
It takes patience and foregoing the morning coffee to assemble a tetrode. Shown here is the insertion of twisted and glued tetrode bundle into the carrier. Once inserted, the ends are cut, and electrical connections made to the wires using conductive pain. Before use, the tips are placed with gold. (Click here or on the photograph to see an enlarged area of detail.)
Panel 6
FINAL PRODUCT
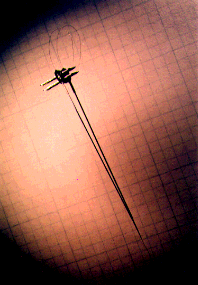
And here's the final product! Prior to use, the impedance of each wire is tested at 1 kHz using a normal impedance tester (BAK). Good, plated tetrodes have a fresh impedance of approximately 0.1 M ohm.
Panel 7
DESIGN (MkI)

- Three lengths of cannulae form a tapered carrier tube, the end of which
is sharpened.
- The tetrode bundle, four individually insulated 15 um wires twisted
together and glued with cyanoacrylate, runs in the center cannula.
- The center cannula is filled with silicone oil to lubricate the tetrode
bundle and displace physiological fluids.
- Electrical connections are established through a four-pin connector,
here seen on end.
- In operation, the carrier is advanced a few millimeters beyond the end of
a guide tube which has punctured the dura. The tetrode bundle is then
advanced into the area under investigation.
- Drawing not to scale.
Panel 8
DESIGN (MkII)

- Three lengths of cannulae form a thicker carrier tube, the end of which
is, again sharpened. This tube is able to pierce the dura obviating the
need for an additional guide tube.
- The tetrode is attached to a second sleeve of layered cannula that slides
over the carrier. The point of attachment is coaxial with the carrier
channel.
- In operation the carrier is used to puncture the dura but does not
advance into the brain. The upper cannula is advanced over the carrier,
forcing the tetrode alone into the brain.
- This design allows confident and rapid advancement of the tetrode by
standard hydraulic microdrives.
- Drawing not to scale.
Panel 9
RELATIVE SIZES
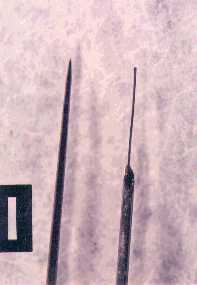
The business ends of two electrodes: on the left is a traditional tungsten electrode from FHC, on the right is a tetrode extended to approximately 10 mm. (Click here or on the photograph to see an enlarged area of detail.)
Panel 10
TETRODE AGAINST CELLS
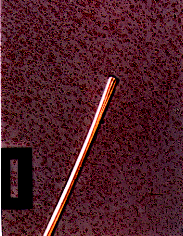
This photomicrograph shows the end of a tetrode against a Nissl stained brain section, showing the relative size of the bundle diameter and cell bodies. Unlike other similar photomontages, this is a single photograph. (Click here or on the photograph to see an enlarged area of detail.)
Panel 11
FIVE DEEP LESIONS
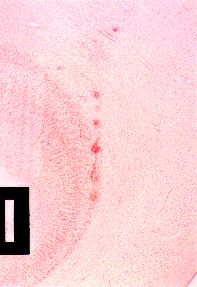
Five lesions can be seen in this 50 um brain section, approximately 500 um apart. Lesions were made with 10 uA of current for 10 s, at a tetrode bundle extension of approximately 10 mm. (Click here or on the photograph to see an enlarged area of detail.)
Panel 12
IMPEDANCE CURVES
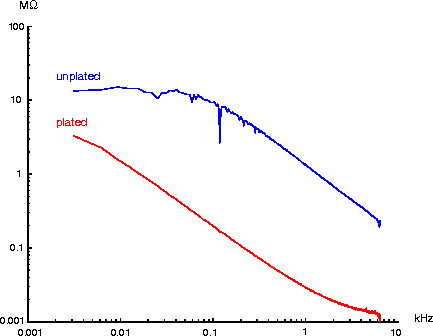
- This graph shows a spectral analysis of tetrode tip impedance for a typical
wire.
- The spectrum shown in blue is of a freshly cut tip in saline (the
trough at 120 Hz is an artifact). The curve in red is the same tip after
it has been plated in gold chloride solution at 10 uA for 5 s.
- Plating lowers the tip impedance by almost two orders of magnitude at
1 kHz.
Panel 13
TETRODE DATA
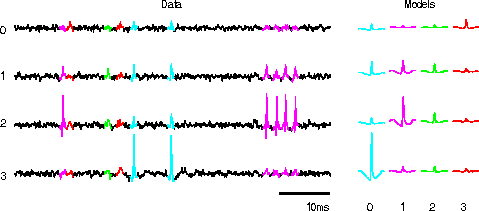
- This is an example of data recorded from a tetrode.
- On the left is a short stretch of the four channels of data. They have
been sampled at 12.8 kHz (after a nine-pole anti-aliasing filter) and
digitally highpass filtered at 300 Hz.
- The colored sections of this trace represent identified events. The
different colors mark events from presumably different units.
- On the right are the average waveforms recorded from the four identified
cells.
- Notice how similar three of the four waveforms are on channel 1.
Panel 14
CLUSTER PLOT
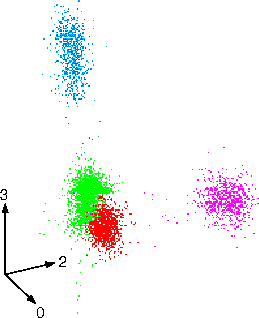
- We can take each event identified previously and plot the peak value
attained during that event on a cluster plot. (Of the four possible
dimensions, we have projected three on to the page).
- The colors correspond to those on the previous page.
- On this graph, the clusters of peaks are well separated. However, if
two units were to fire together the summed event would fall outside these
clusters (there might be some such points on this graph).
- More frequently, the clusters merge into one, making these diagrams of
limited use in event identification. For such data sets, we are forced to
explore other metrics.
John Pezaris
Caltech
Mail Code 216-76
Pasadena, CA 91125
pz@caltech.edu 23 August 1995